Remote Sensing
Before learning how to load, process, and analyze satellite imagery in Google Earth Engine, it will be helpful to know a few basic principles of remote sensing. This section provides a brief overview of some important concepts and terminology that will be used throughout the course, including active and passive sensors; spatial, spectral and temporal resolution; and orbits.
Active and Passive Sensors
Remote sensing is the science of obtaining information about an object or phenomenon without making physical contact with the object. Remote sensing can be done with various types of electromagnetic radiation such as visible, infrared or microwave. The electromagnetic radiation is either emitted or reflected from the object being sensed. The reflected radiation is then collected by a sensor and processed to obtain information about the object.
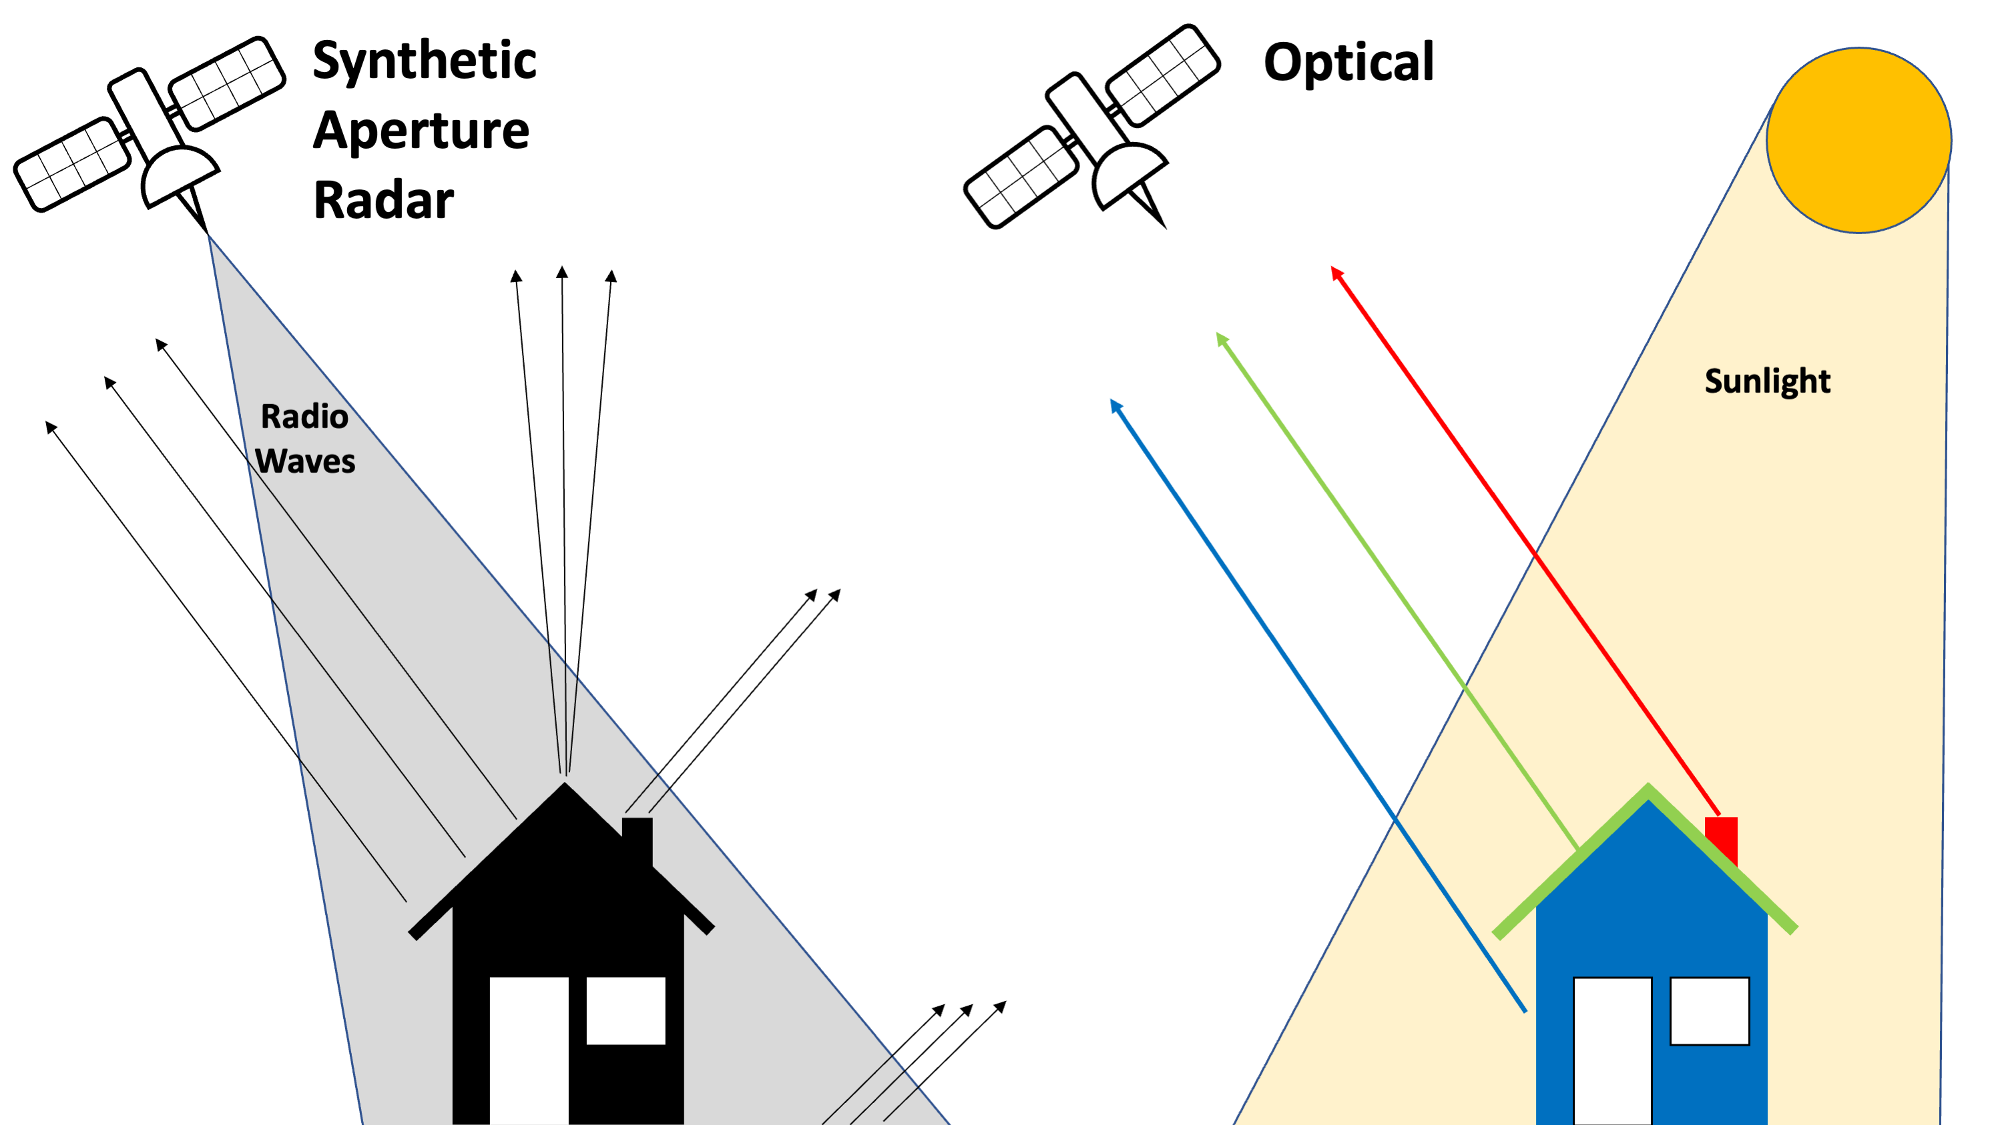
While most satellite imagery is optical, meaning it captures sunlight reflected by the earth’s surface, Synthetic Aperture Radar (SAR) satellites such as Sentinel-1 work by emitting pulses of radio waves and measuring how much of the signal is reflected back. This is similar to the way a bat uses sonar to “see” in the dark: by emitting calls and listening to echoes.
Resolution
Resolution is one of the most important attributes of satellite imagery. There are three types of resolution: spatial, spectral, and temporal. Let’s look at each of these.
Spatial Resolution
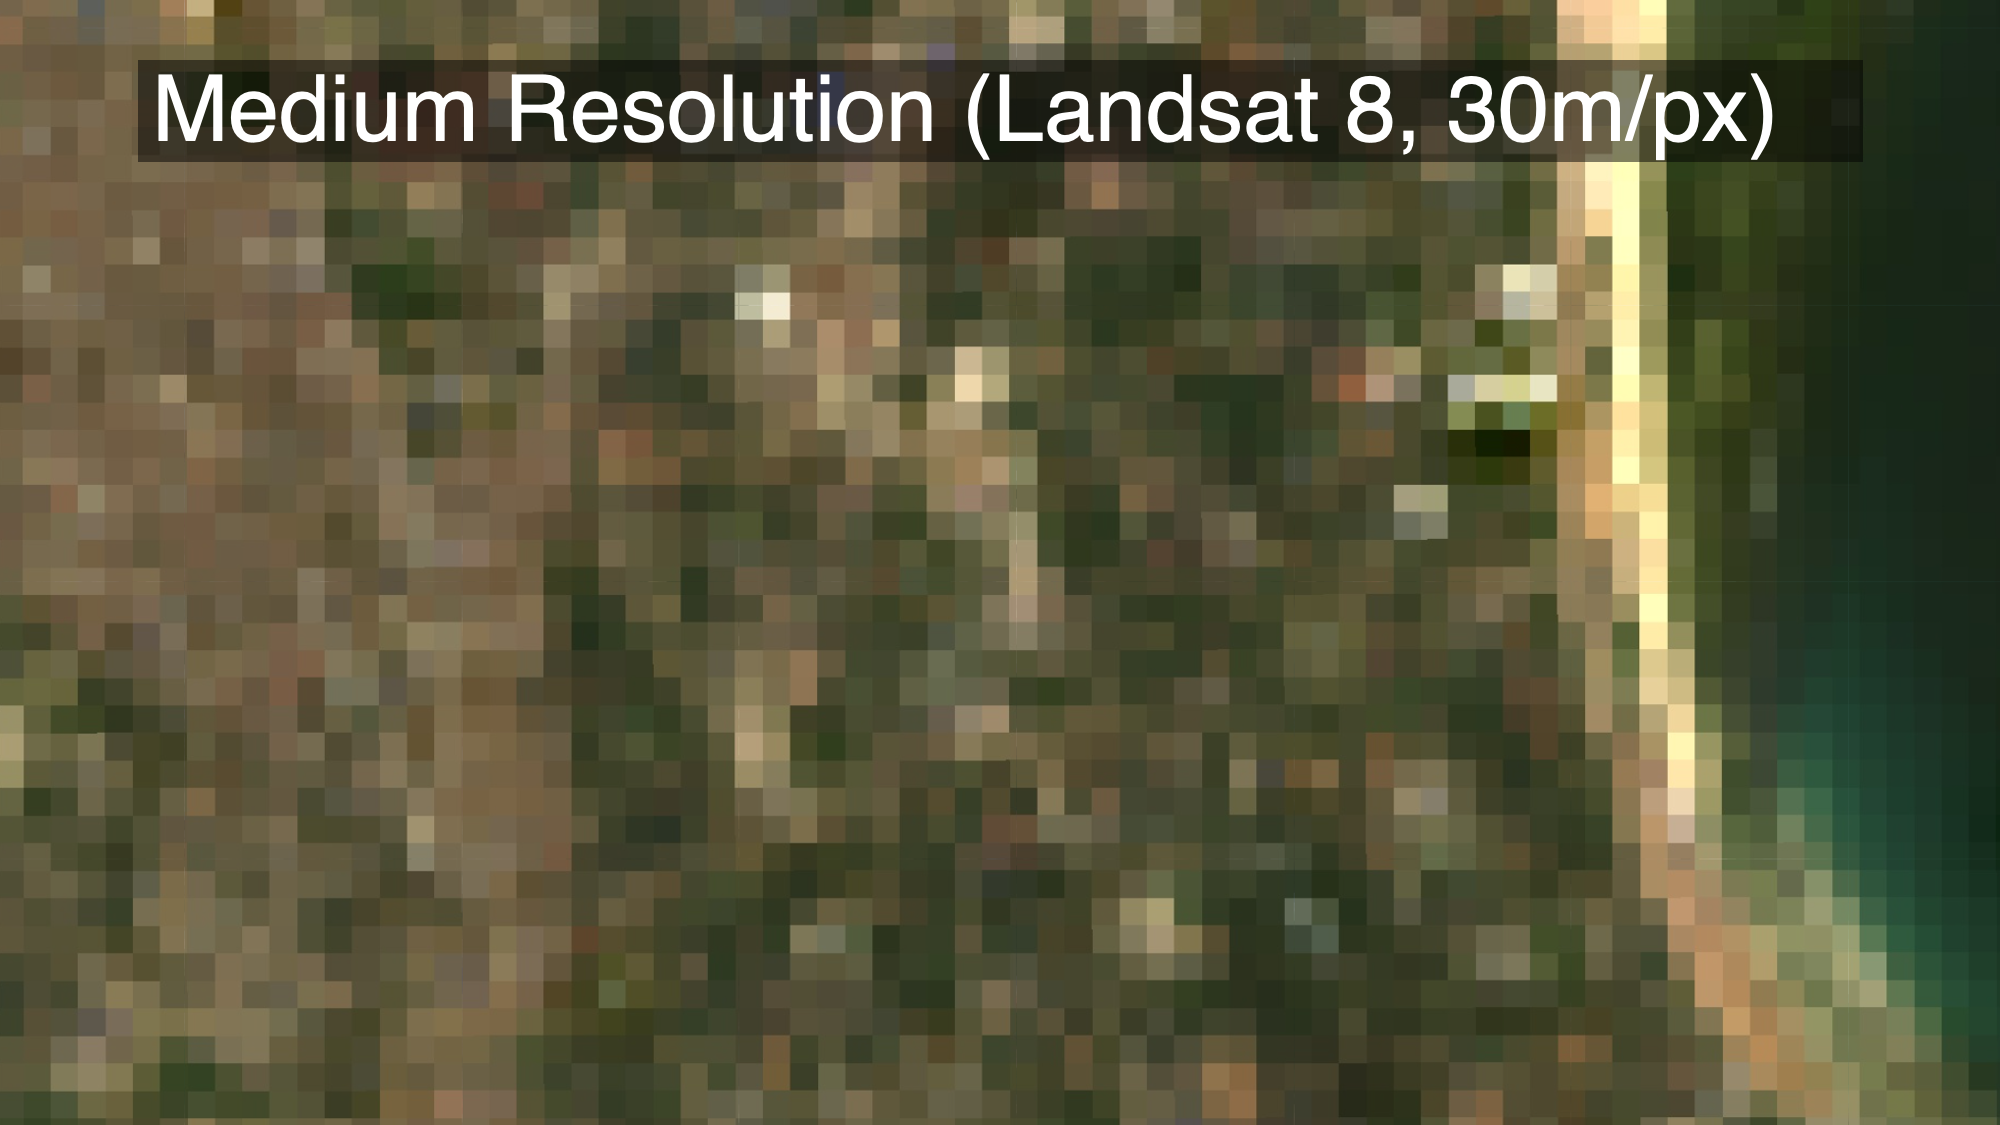
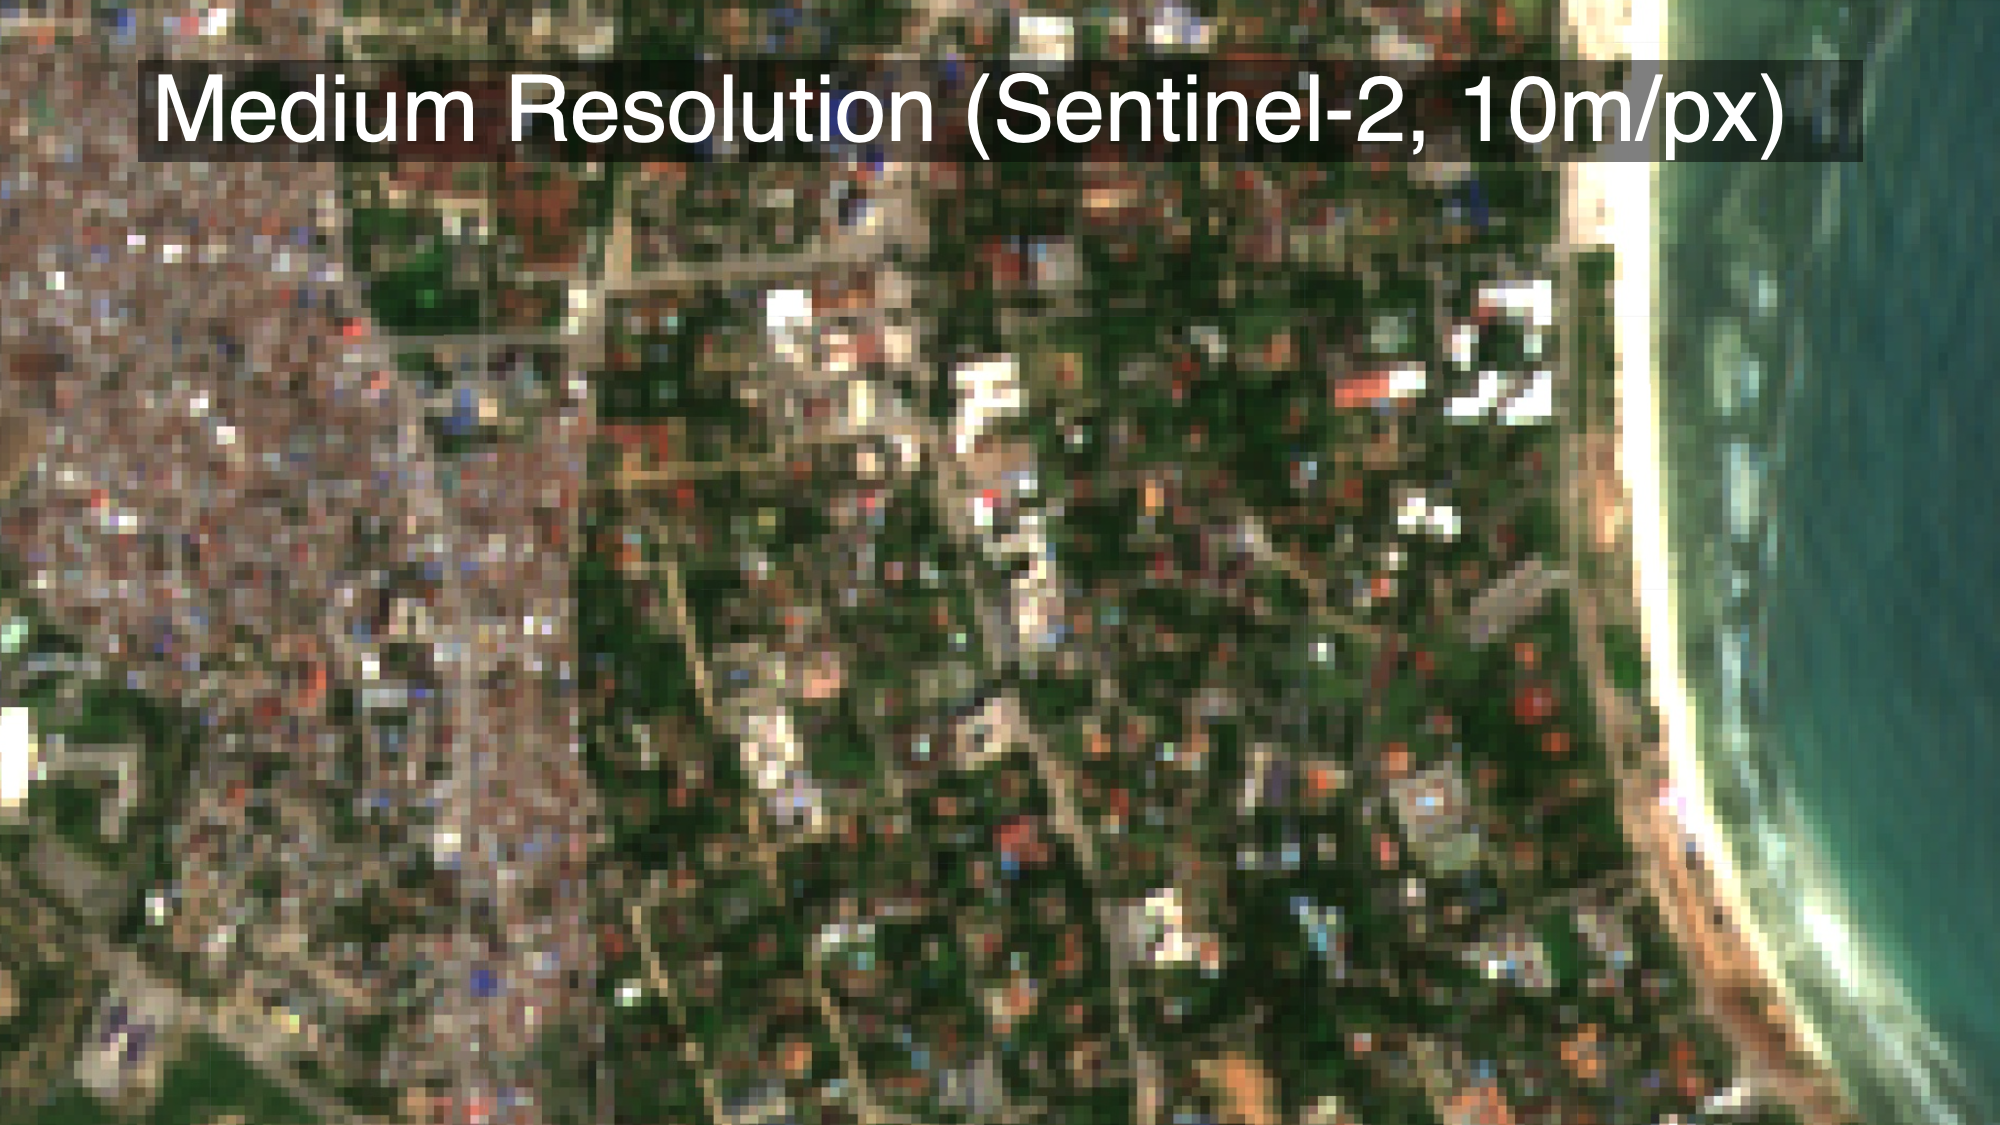
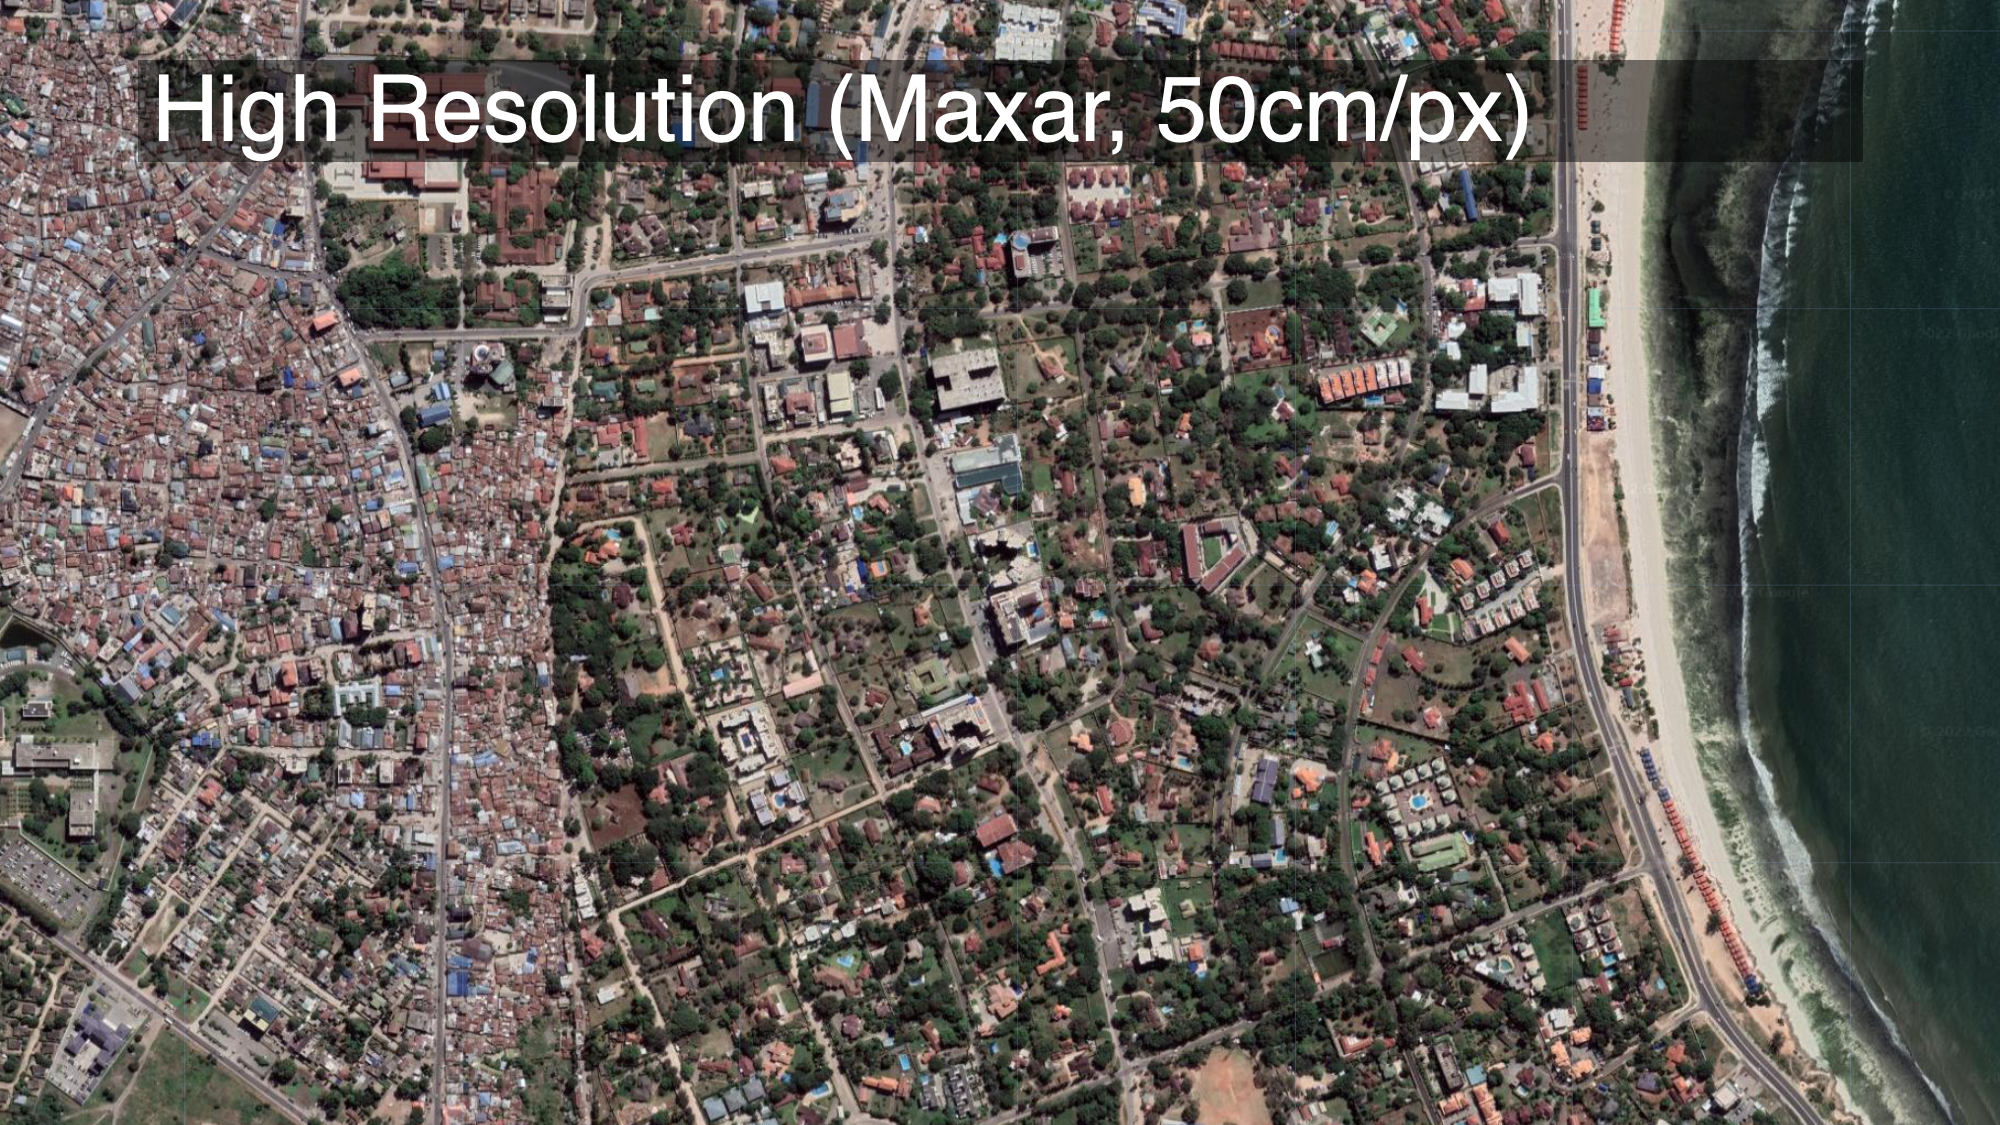
Spatial resolution governs how “sharp” an image looks. The Google Maps satellite basemap, for example, is really sharp. Most of the optical imagery that is freely available has relatively low spatial resolution (it looks more grainy than, for example, the Google satellite basemap),
Spectral Resolution
What open access imagery lacks in spatial resolution it often makes up for with spectral resolution. Really sharp imagery from MAXAR, for example, mostly collects light in the visible light spectrum, which is what our eyes can see. But there are other parts of the electromagnetic spectrum that we can’t see, but which can be very useful for distinguishing between different materials. Many satellites that have a lower spatial resolution than MAXAR, such as Landsat and Sentinel-2, collect data in a wider range of the electromagnetic spectrum.
Different materials reflect light differently. An apple absorbs shorter wavelengths (e.g. blue and green), and reflects longer wavelengths (red). Our eyes use that information– the color– to distinguish between different objects. Below is a plot of the spectral profiles of different materials:
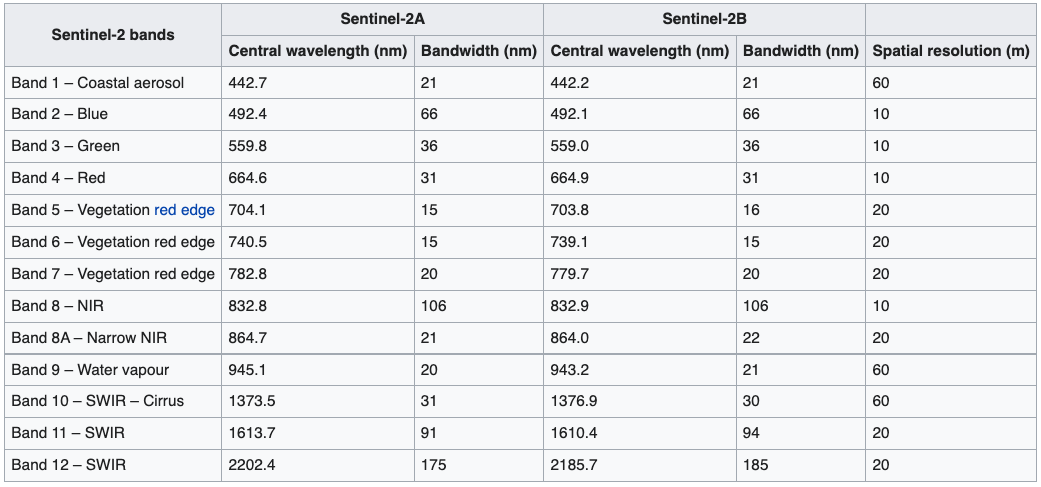
The visible portion of the spectrum is highlighted on the left, ranging from 400 nanometers (violet) to 700nm (red). Our eyes (and satellite imagery in the visible light spectrum) can only see this portion of the light spectrum; we can’t see UV or infrared wavelengths, for example, though the extent to which different materials reflect or absorb these wavelengths is just as useful for distinguishing between them. The European Space Agency’s Sentinel-2 satellite collects spectral information well beyond the visible light spectrum, enabling this sort of analysis. It chops the electromagnetic spectrum up into “bands”, and measures how strongly wavelengths in each of those bands is reflected:
To illustrate why this is important, consider Astroturf (fake plastic grass). Astroturf and real grass will both look green to us, especially from a satellite image. But living plants strongly reflect radiation from the sun in a part of the light spectrum that we can’t see (near-infrared). There’s a spectral index called the Normalized Difference Vegetation Index (NDVI) which exploits this fact to isolate vegetation in multispectral satellite imagery. So if we look at Gillette Stadium near Boston, we can tell that the three training fields south of the stadium are real grass (they generate high NDVI values, showing up red), while the pitch in the stadium itself is astroturf (generating low NDVI values, showing up blue).
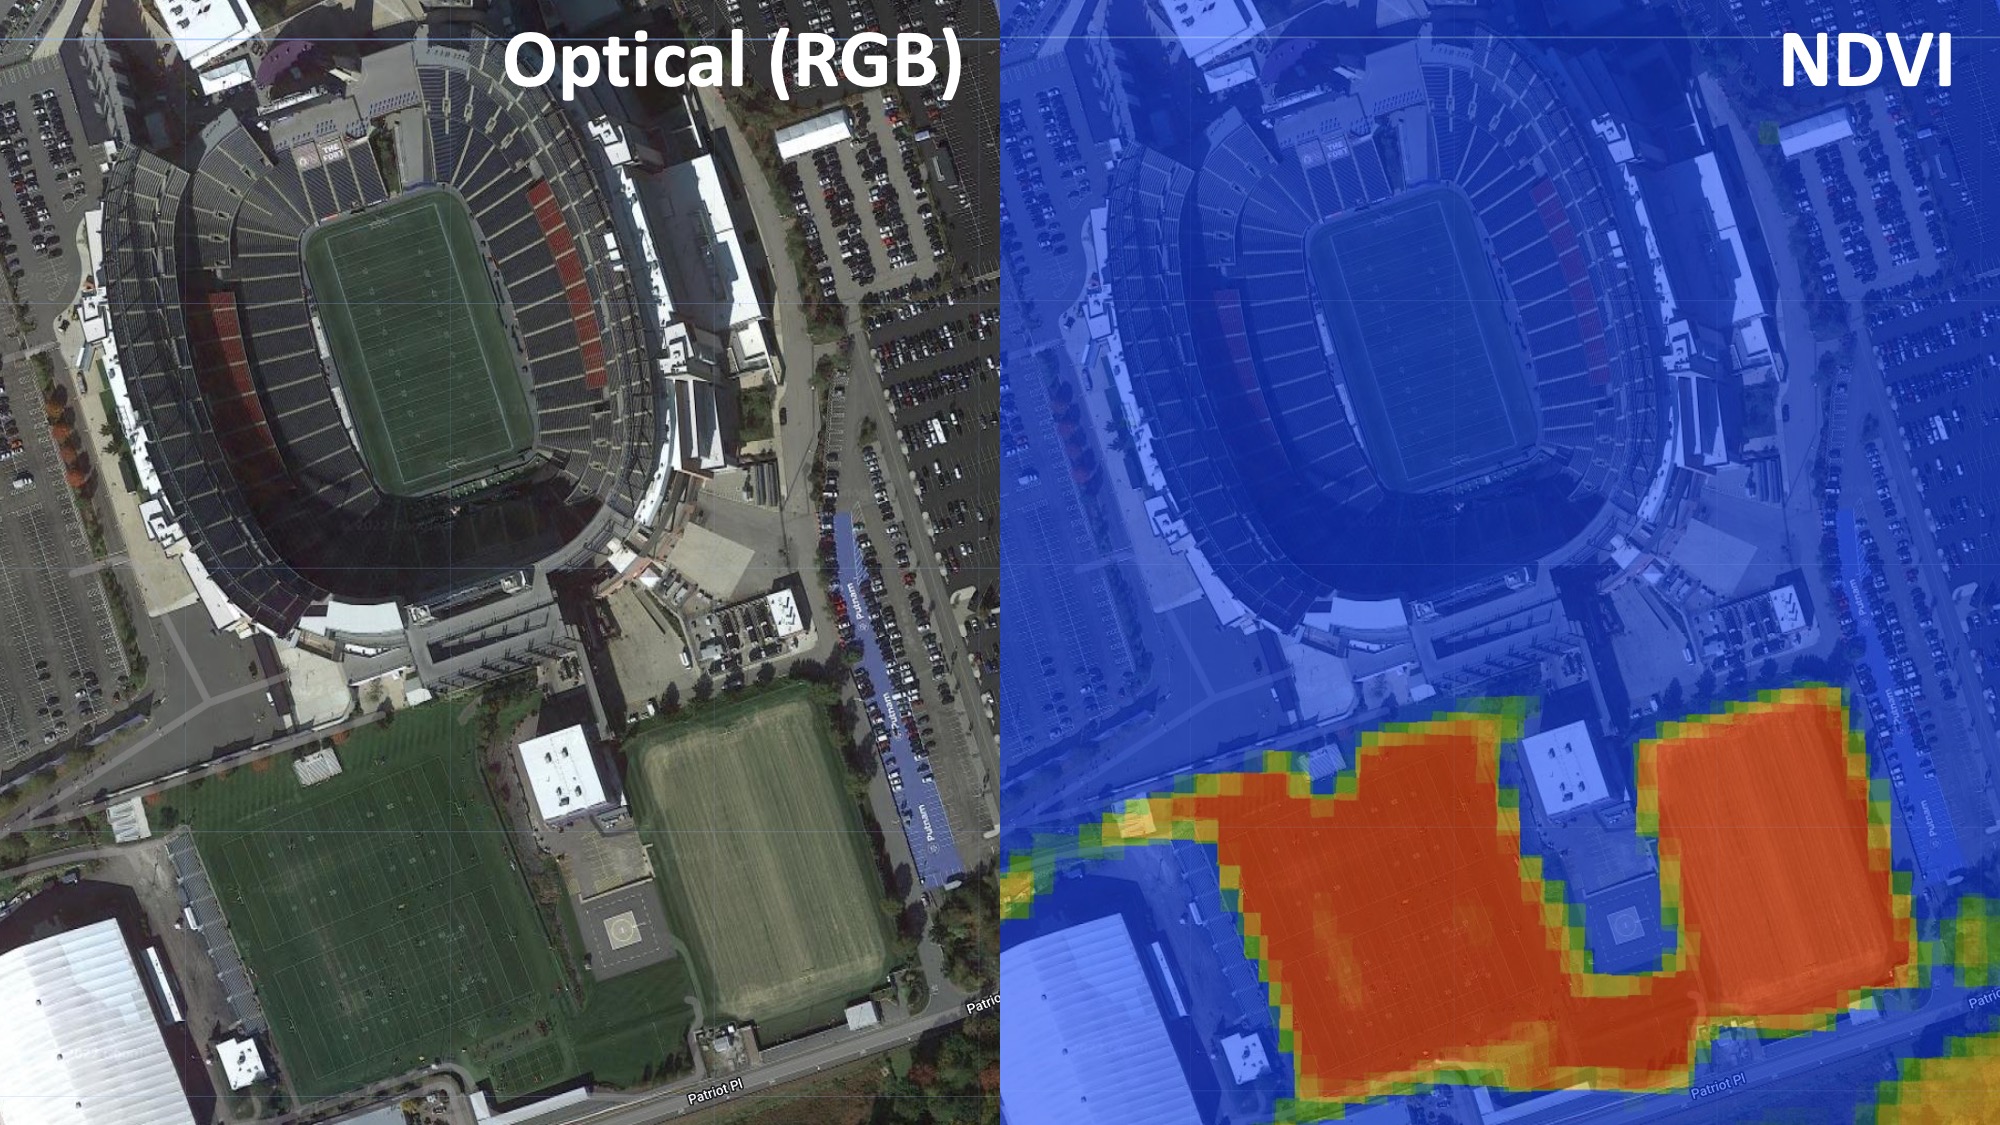
In other words, even though these fields are all green and indistinguishable to the human eye, their spectral profiles beyond the visible light spectrum differ, and we can use this information to distinguish between them.
Astroturf is a trivial example. But suppose we were interested in identifying makeshift oil refineries in Northern Syria that constitute a key source of rents for whichever group controls them. As demonstrated in the ‘Refinery Identification’ case study, we can train an algorithm to identify the spectral signatures of oil, and use that to automatically detect them in satellite imagery.
Temporal Resolution
Finally, the frequency with which we can access new imagery is an important consideration. This is called the temporal resolution.
The Google Maps basemap is very high resolution, available globally, and is freely available. But it has no temporal dimension: it’s a snapshot from one particular point in time. If the thing we’re interested in involves changes over time, this basemap will be of limited use.
The “revisit rate” is the amount of time it takes for the satellite to pass over the same location twice. For example, the Sentinel-2 constellation’s two satellites can achieve a revisit rate of 5 days, as shown in this cool video from the European Space Agency:
Some satellite constellations are able to achieve much higher revisit rates. Sentinel-2 has a revisit rate of 5 days, but SkySat is capable of imaging the same point on earth around 12 times per day! How is that possible? Well, as the video above demonstrated, the Sentinel-2 constellation is composed of two satellites that share the same orbit, 180 degrees apart. In contrast, the SkySat constellation comprises 21 satellites, each with its own orbital path:
This allows SkySat to achieve a revisit rate of 2-3 hours. The catch, however, is that you need to pay for it (and it ain’t cheap). Below is a comparison of revisit rates for various other optical satellites:

Summary
You should hopefully have a better understanding of what satellite imagery is, and how it can be used to answer questions about the world. In the next section, we’ll look at the various types of satellite imagery stored in the Google Earth Engine catalog.